Monitoring-
Report Feed 2014
Monitoring-
Report Feed 2014
Monitoring-
Report Feed 2014
Salmonella 49,312
12 Pig feed
12 RPost-extraction rapeseed
meal, rapeseed cake
7 Soya (oil) cake, hulls;
post-extraction soya meal
5 Dairy cow feed, cattle feed
4 Sunflower seed, cake;
extracted sunflower seed
3 Poultry feed
3 Cocoa shells
8 Various feed material products
1 Supplementary feed
for pigs
1 Supplementary feed for
fattening pigs
1 Shrimps
1 Yeast
Heavy metals 108,393
Parameter
Number
of tests
No. of positive
results…
…in feed/
raw materials
54 of 49,312
samples tested
positive (0.1 %)
Parameter
Number
of tests
No. of results
exceeding
maximum level …
13 in total
Dioxins
and dl-PCBs 38,186
Of the 16,494
tests, a value was
measured in
14,261 (86.5 %)
1
1
(Sugar) beet
molasses chips,
(sugar) beet pieces
dl-PCBs
Dioxins
Of the 14,486
tests, a value was
measured in
11,874 (82 %)
There were no
results
exceeding the
maximum level
1
(Sugar) beet
molasses chips
ndl-PCBs
10,904
Of the 10,904
tests, a value was
measured in
(50.4 %)
1
1 in total
–
Mixed fatty acids
Total of
dioxins
and
dl-PCBs
Of the 7,206
tests, a value was
measured in
5,943 (82.5 %)
1
–
Fatty acids from
chemical refining
(refining
fatty acids)
1
–
Shrimps
1
1
Fatty acids from
chemical refining
(refining
fatty acids)
1
–
Fruit pulp
–
1
Salts of
fatty acids
–
1
By-products from
the milk
processing industry
Out of 26,478
tests, a value was
measured in
8,840 (33.4 %)
…in feed/
raw materials
Arsenic
1 Complete feed for
fattening pigs (up to 50 kg)
1 Calcium carbonate
1 Yeast
Out of 27,759
tests, a value was
measured in
12,424 (44.8 %)
Lead
1 Cocoa shells
1 Growing crops from
permanent pastures
(fresh, ensiled or dried)
1 Shrimps
Out of 27,595
tests, a value was
measured in 17,528
(63.5 %)
Cadmium
Arsenic
Of the 8,840 tests in which
a value was measured,
there were...
0-1 mg/kg
6,936 tests between
0 and 1 mg/kg
> 1 mg/kg
1,904 above 1 mg/kg
Lead
Of the 12,424 tests in which
a value was measured,
there were…
0-5 mg/kg
11,947 tests between
0 and 5 mg/kg
> 5 mg/kg
477
Cadmium
Of the 17,528 tests in which
a value was measured,
there were…
0-1 mg/kg
17,212 tests between
0 and 1 mg/kg
> 1 mg/kg
316
Mercury
Of the 2,653 tests in which
a value was measured,
there were…
0-0.05 mg/kg
2,418 tests between
0 and 0.05 mg/kg
> 0.05 mg/kg
235
2 Yeast
1 Supplementary feed
for fattening pigs
Out of 26,561
tests, a value
was measured in
2,653 (10 %)
Mercury
Salmonella
Dioxins, dioxin-like PCBs (dl-PCBs) and non-dioxin-like PCBs
(ndl-PCBs)
Heavy metals
Test results for heavy metals in detail
Parameter
Result
Result
Parameter
Number
of tests
No. of results
exceeding
maximum level
No. of results
exceeding guidance
value/intervention value
…in feed/
raw materials
Test results for dioxins, dioxin-like PCBs and non-dioxin-like
PCBs in detail
Dioxins
Of the 14,261 tests in
which a value was
measured, there
were…
0-0.25 ng/kg
13,132 between
0 and 0.25 ng/kg
> 0.5 ng/kg
269 above
0.35 ng/kg
Parameter
Results
> 0.25-0.5 ng/kg
903 between
0.25 and 0.5 ng/kg
dl PCBs
Of the 11,874 tests in
which a value was
measured, there
were…
0-0.2 ng/kg
11,335 between
0 and .02 ng/kg
> 0.35 ng/kg
269 above
0.35 ng/kg
> 0.2-0.35 ng/kg
270 between
0.2 and 0.35 ng/kg
Total dioxins +
dl PCBs
Of the 5,943 tests in
which a value was
measured, there
were…
0-0.5 ng/kg
5,448 between
0 and 0.5 ng/kg
> 1.0 ng/kg
237 above
1.0 ng/kg
> 0.5-1.0 ng/kg
258 between
0.5 and 1.0 ng/kg
ndl PCBs
Of the 5,500 tests in
which a value was
measured, there
were…
0-5 µg/kg
4,890 between
0 and 5 µg/kg
> 10 µg/kg
263 above
10 µg/kg
> 5-10 µg/kg
347 between
5 and 10 µg/kg
Results
Results
4 Corn
1 Corn gluten
Parameter
Number of tests
No. of results
exceeding
maximum level
19,167
Of the 19,167 tests,
a value was
measured in 2,019
(10.5 %)
5 in total
…in feed/
raw materials
Aflatoxin B1
Aflatoxin B1
15 Agricultural business:
own mixture –
pig fattening/sows/pigletsl
9 Complete feed for sows
9 Complete feed for
fattening pigs
3 Piglet rearing feed
4 Supplementary feed for sows/
piglets/fattening pigs
1 Corn plants
1 Wheat
1 Oats
Parameter
Number of tests
No. of results
exceeding
EU reference value
…in feed/
raw materials
29,137
Of the 29,137 tests,
a value was
measured in
15,297 (52.5 %)
43 in total
DON
Deoxynivalenol
Test results for aflatoxin B1 in detail
Feed material
Of the 1,543 tests in
which a value was
measured, there
were…
0-10 µg/kg
1,457 between
0 and 10 µg/kg
> 20 µg/kg
5 above 20 µg/kg
Feed
Results
> 10-20 µg/kg
81 between
10 and 20 µg/kg
Compound feed
Of the 476 tests in
which a value was
measured, there
were…
0-5 µg/kg
469 between
0 and 5 µg/kg
> 10 µg/kg
No value above
10 µg/kg was
measured
> 5-10 µg/kg
7 between 5 and
10 µg/kg
Results
Results
2 Piglet rearing feed
2 Corn (plants)
1 Triticale
1 Own mixtures – pig production
1 Own mixtures – cattle production
Parameter
Number of tests
No. of results
exceeding
EU reference value
…in feed/
raw materials
Zearalenone (ZEA)
Test results for ZEA in detail
Feed material
Of the 5,314 tests in
which a value was
measured, there
were…
0-1 mg/kg
5,228 between
0 and 1 mg/kg
> 2 mg/kg
and 54 above
2 mg/kg
Feed
Results
> 1-2 mg/kg
and 32 between
1 and 2 mg/kg
Compound feed
Of the 4,495 tests in
which a value was
measured, there
were…
0-0.1 mg/kg
4,327 between
0 and 0.1 mg/kg
> 0.1 mg/kg
and 168 above
0.1 mg/kg
Results
Results
Test results for DON in detail
Feed material
Of the 9,512 tests in
which a value was
measured, there
were…
0-5 mg/kg
9,421 between
0 and 5 mg/kg
> 8 mg/kg
51 above
8 mg/kg
Feed
Results
> 5-8 mg/kg
40 between
5 and 8 mg/kg
Compound feed
Of the 5,785 tests in
which a value was
measured, there
were…
0-0,9 mg/kg
5,639 between
0 and 1 mg/kg
> 0,9 mg/kg
146 above
0.9 mg/kg
Results
Results
27,358
Of the 27,358 tests,
a value was
measured in 9,809
(35.9 %)
7 in total
ZEA
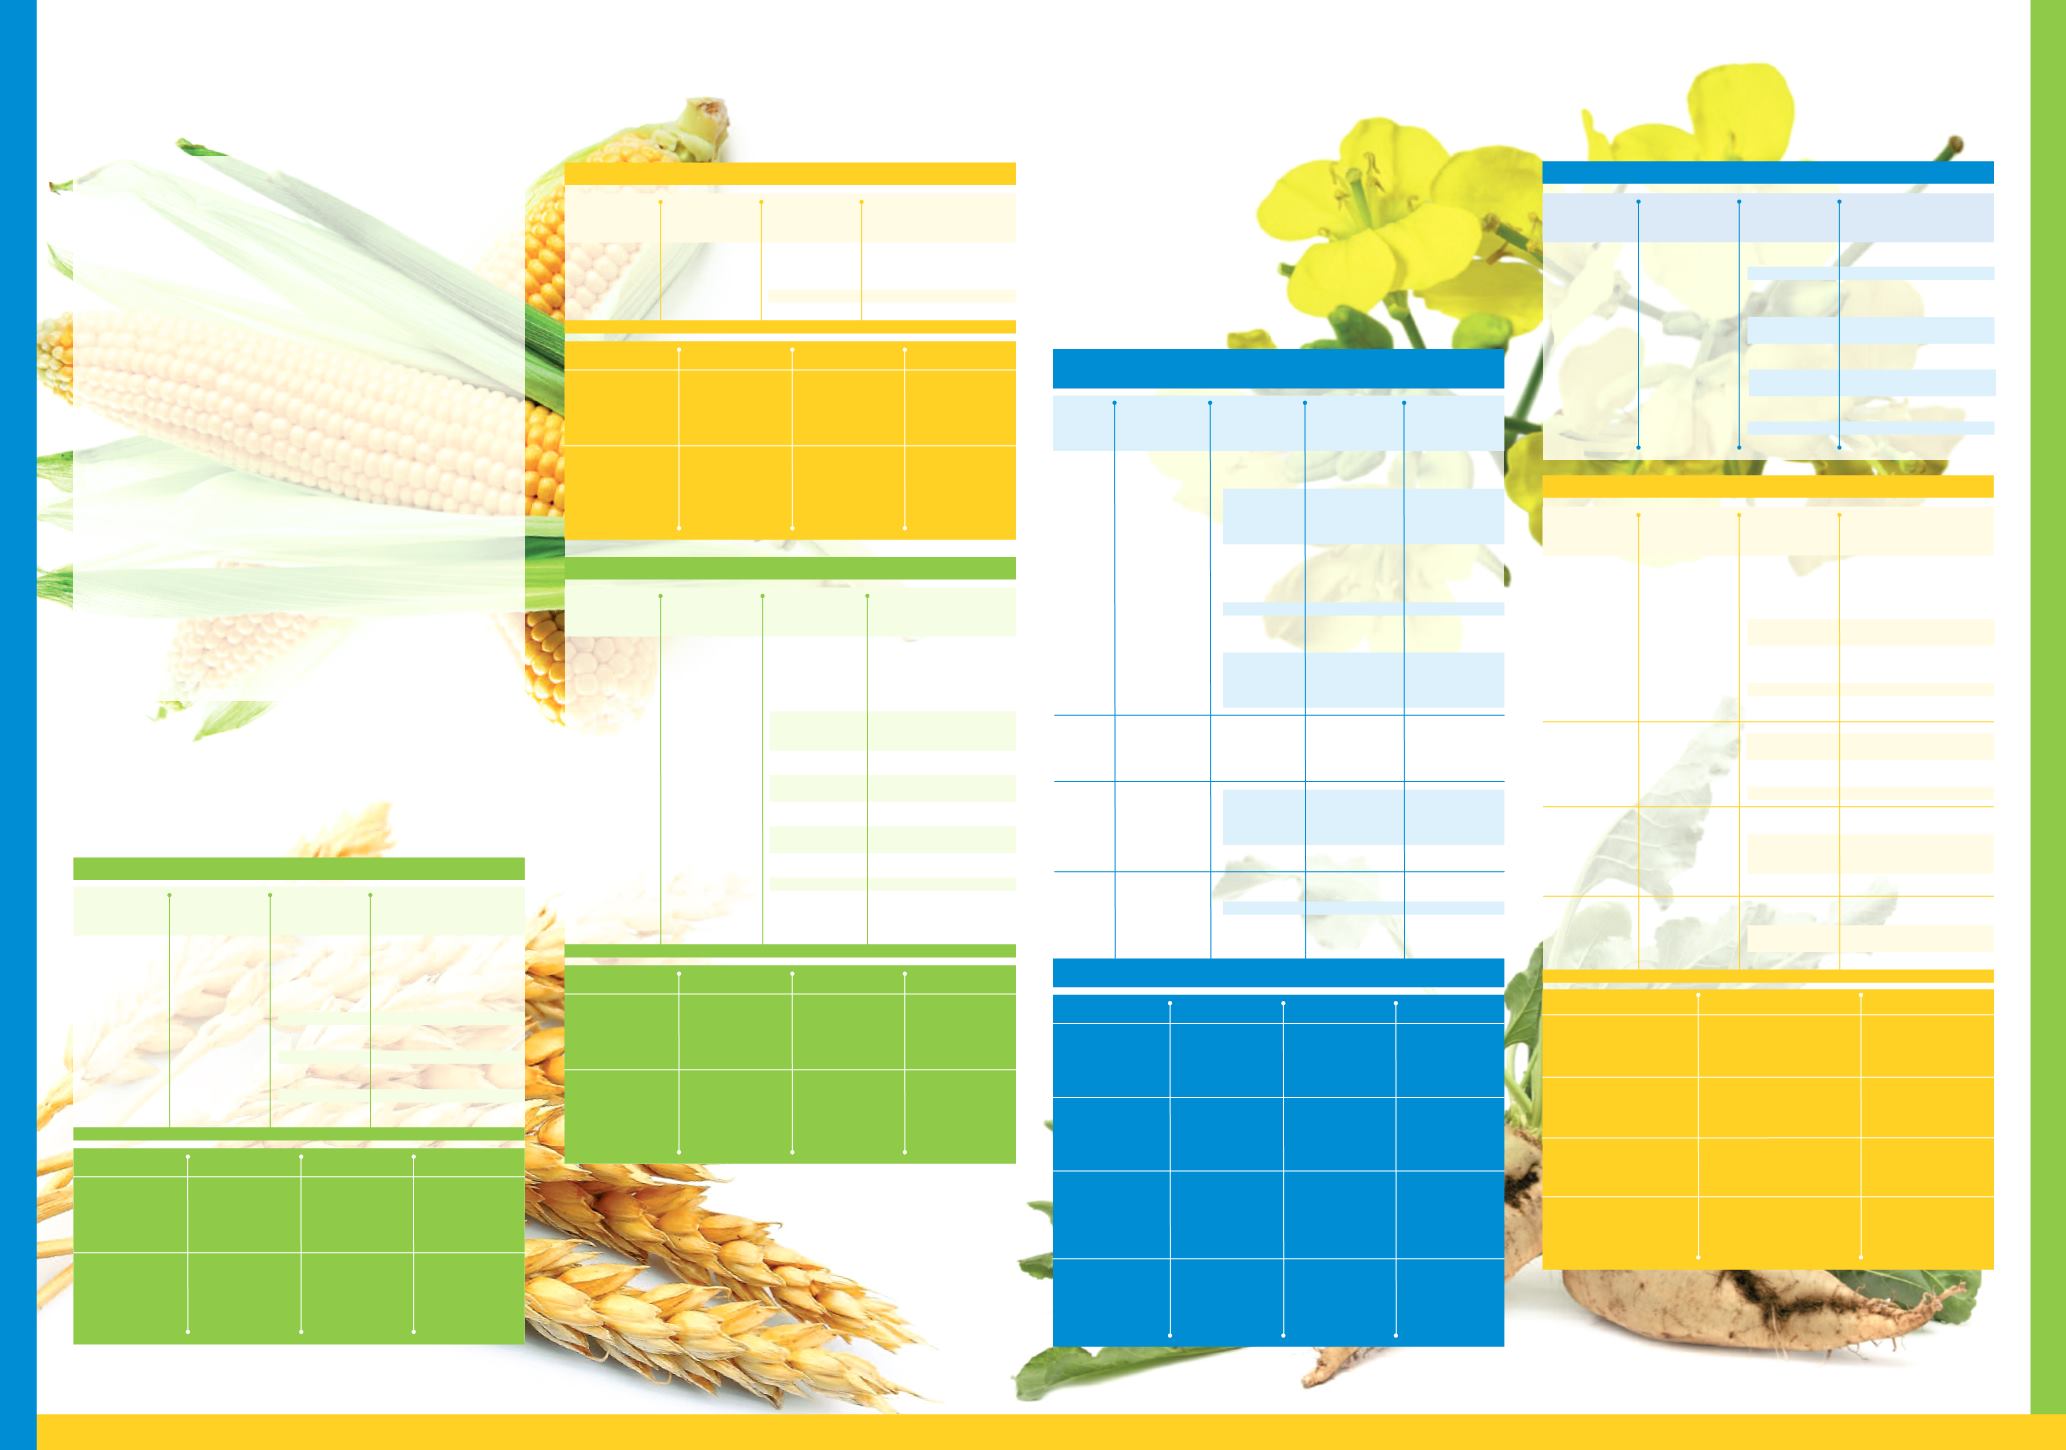
FIGURES AND FACTS
ON CONTAMINANTS
IN ANIMAL FEED
More than 1.6 million individual analyses were evaluated
for the Monitoring Report 2014. This poster depicts the
undesired substances and the feeds in which they were
most frequently detected. To enable proper classification
of the results, the related readings ranges of each ana-
lysis result are also shown. They help to illustrate the
results in relation to the limit values for the various
feeds. This poster helps businesses to compare the ana-
lysis results with those for their own feeds.
Data basis: Analysis results of QS feed monitoring
from January 2008 to September 2014
MONITORING-
REPORT
5 in total
5 in total
54 in total
Imprint
Editor:
QS Qualität und Sicherheit GmbH · Dr. Hermann-Josef Nienhoff, Managing Director · Schedestraße 1-3 · 53113 Bonn, Germany · Phone +49 (0)228 350 68-0 · Fax +49 (0) 228 350 68-10
·
Pictures
: QS Qualität und Sicherheit GmbH, Shutterstock
As of September 2014


