

QS residue monitoring - all current results at a glance
- Evaluation period: 1 October 2022 to 30 September 2023
- Total number of samples analysed: 15,880 (in comparison: 17,047 (2022) / 16,725 (2021))
- Number of samples analysed from Germany: 12,191
- Number of samples analysed from the EU incl. Germany: 15,683
-
Evaluation period: 1 October 2022 to 30 September 2023
-
Total number of samples analysed: 15,880 (in comparison: 17,047 (2022) / 16,725 (2021))
-
Number of samples analysed from Germany: 12,191
-
Number of samples analysed from the EU incl. Germany: 15,683
-
-
Number of samples without MRL exceedance (total): 15,767 (for comparison: 16,932 (2022) / 16,642 (2021))
-
Number of samples exceeding the MRL (total)*: 113 (in comparison: 115 (2022) / 83 (2021))
-
Exceedance rate (total): 0.71% (for comparison: 0.67% (2022) / 0.48% (2021))
-
Exceedance rate for products from Germany: 0.66% (81 of 12,191 samples) (In comparison: 0.64% (2022) / 0.45% (2021))
-
Exceedance rate for products from Europe (incl. Germany): 0.70% (109 of 15,683 samples)
(For comparison: 0.64% (2022) / 0.48% (2021))
-
-
Samples with active substances not authorised for the respective crop (total): 153 (0.96%)
-
Of which from Germany: 141 (0.89%)
-
Of which from the EU (incl. Germany): 150 (0.95%)
-
-
Number of sample countries: 33 (for comparison: 41 (2022) / 45 (2021))
*Basis is the actual value (measured value without taking into account an expanded measurement uncertainty of ± 50 per cent)
Evaluation for the EU
Number of analysed samples (total) per country/samples with MRL exceedance
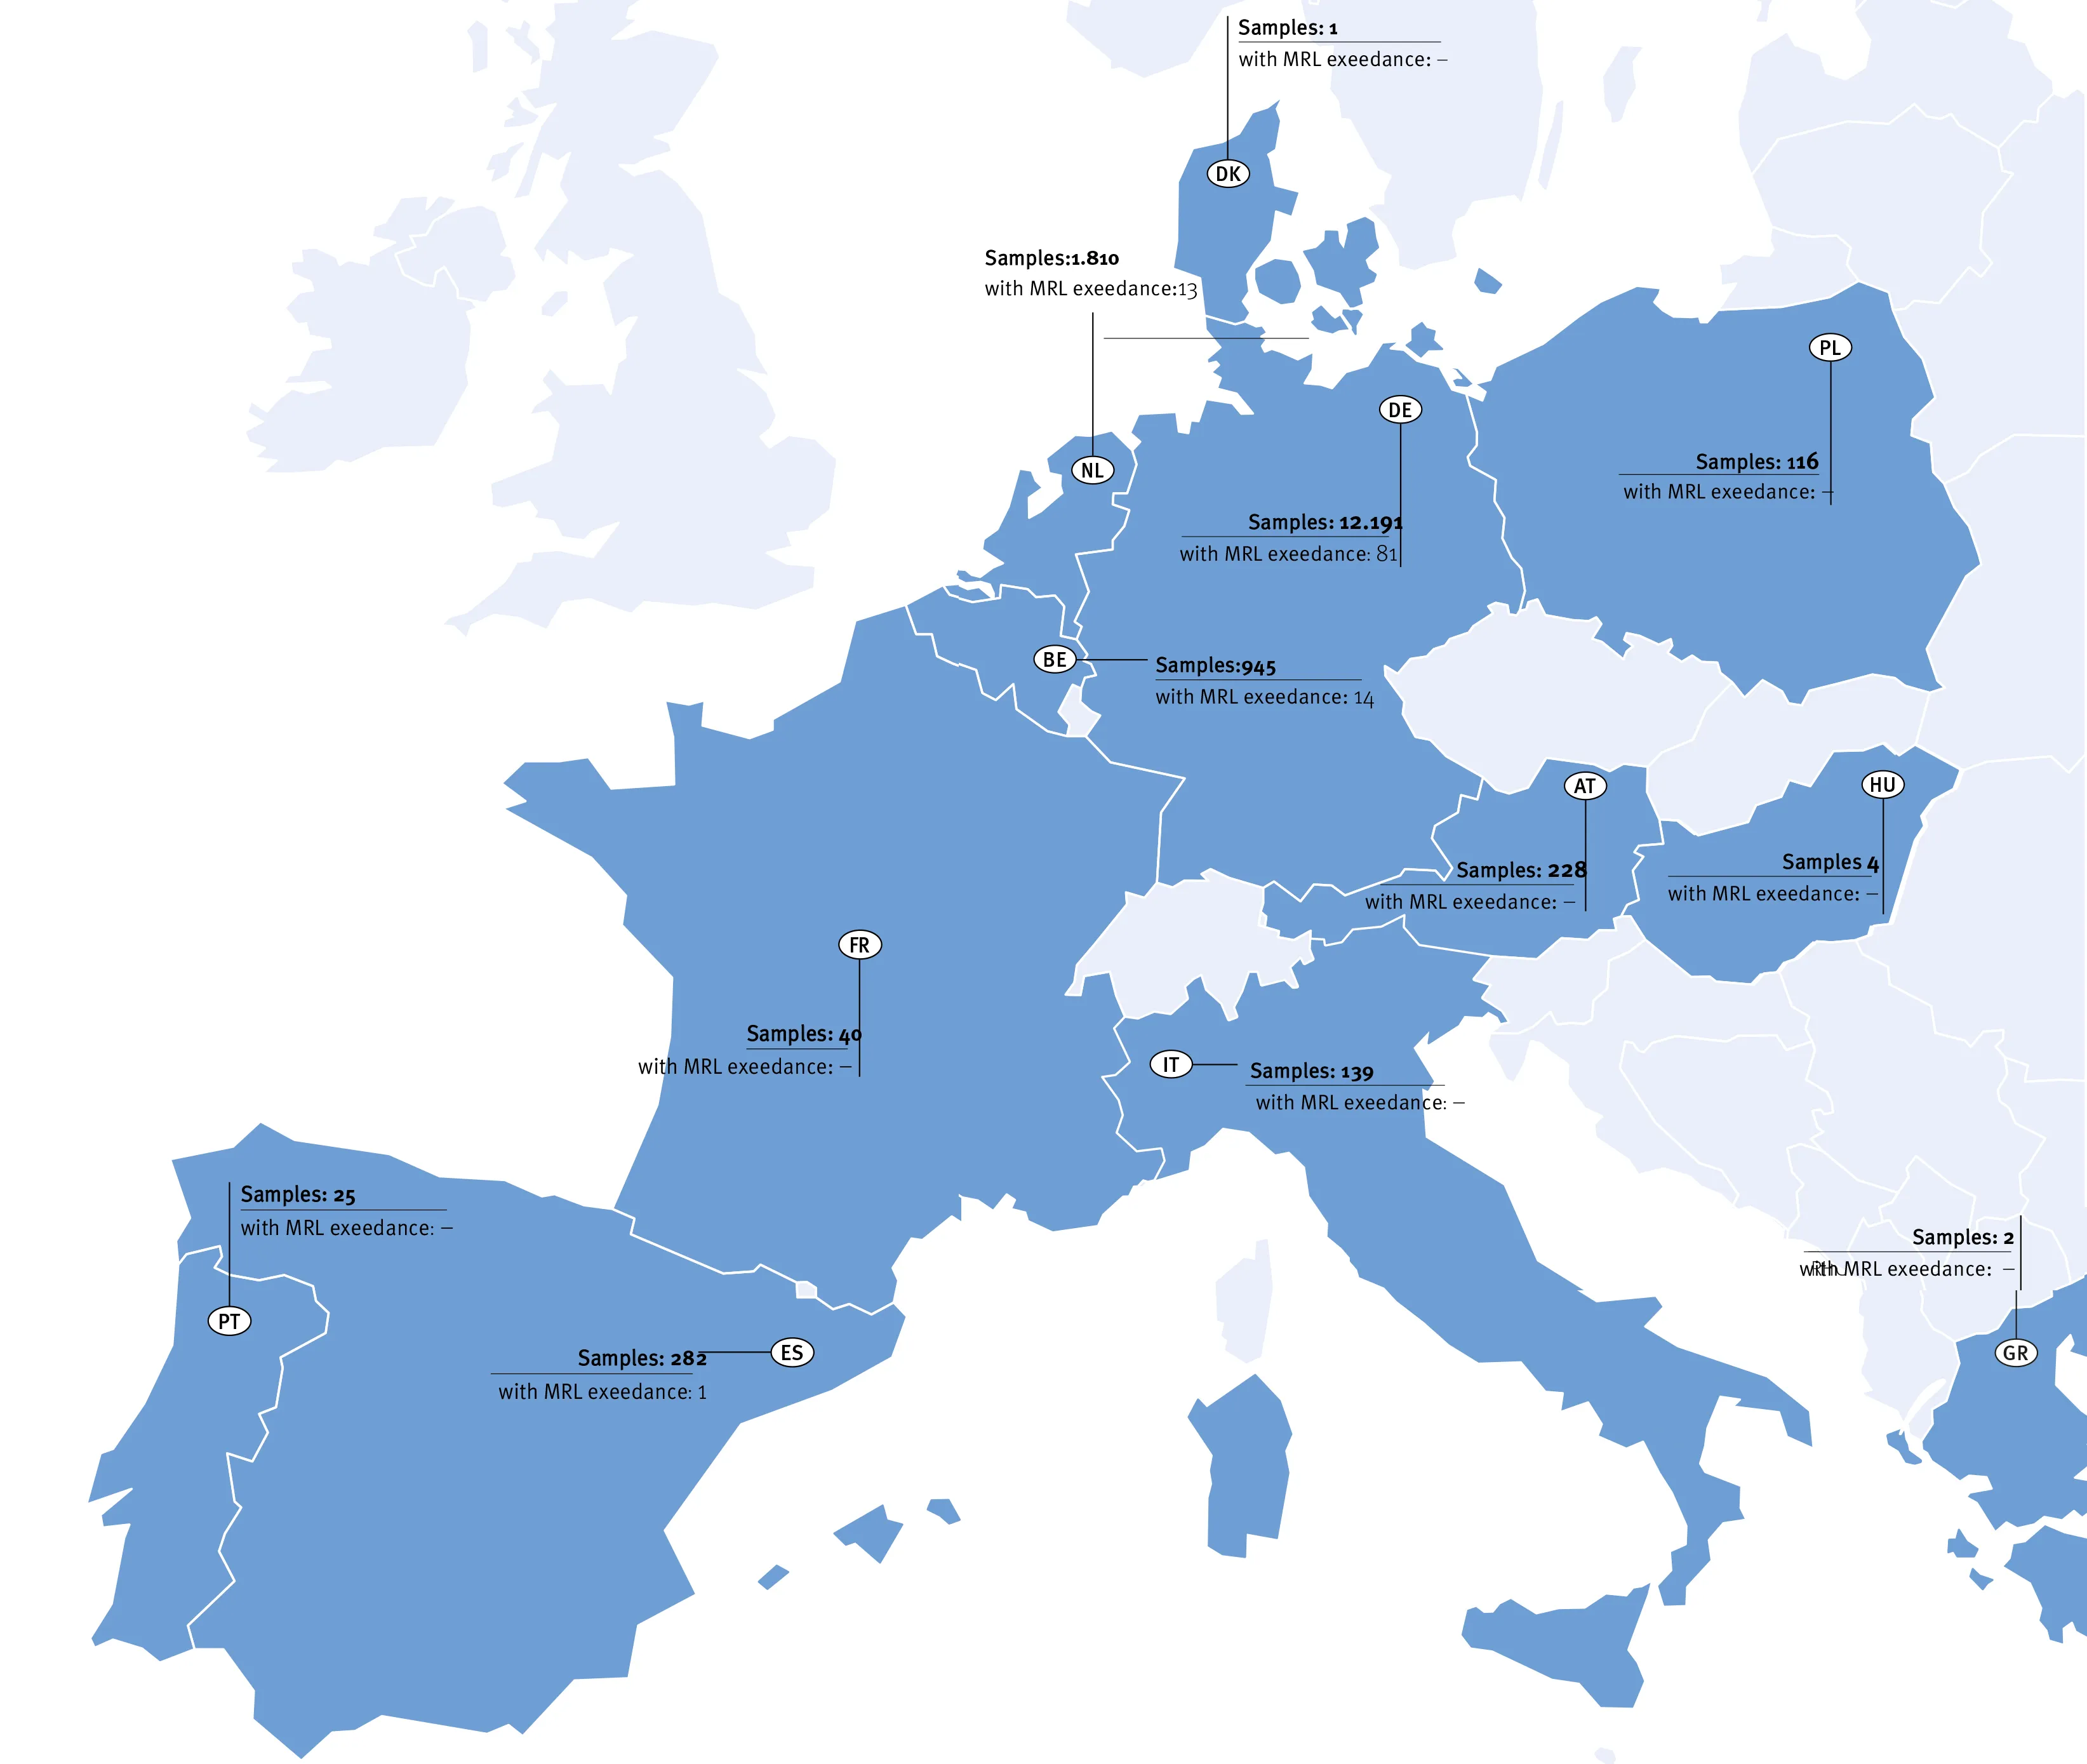
Click on the graphic to enlarge
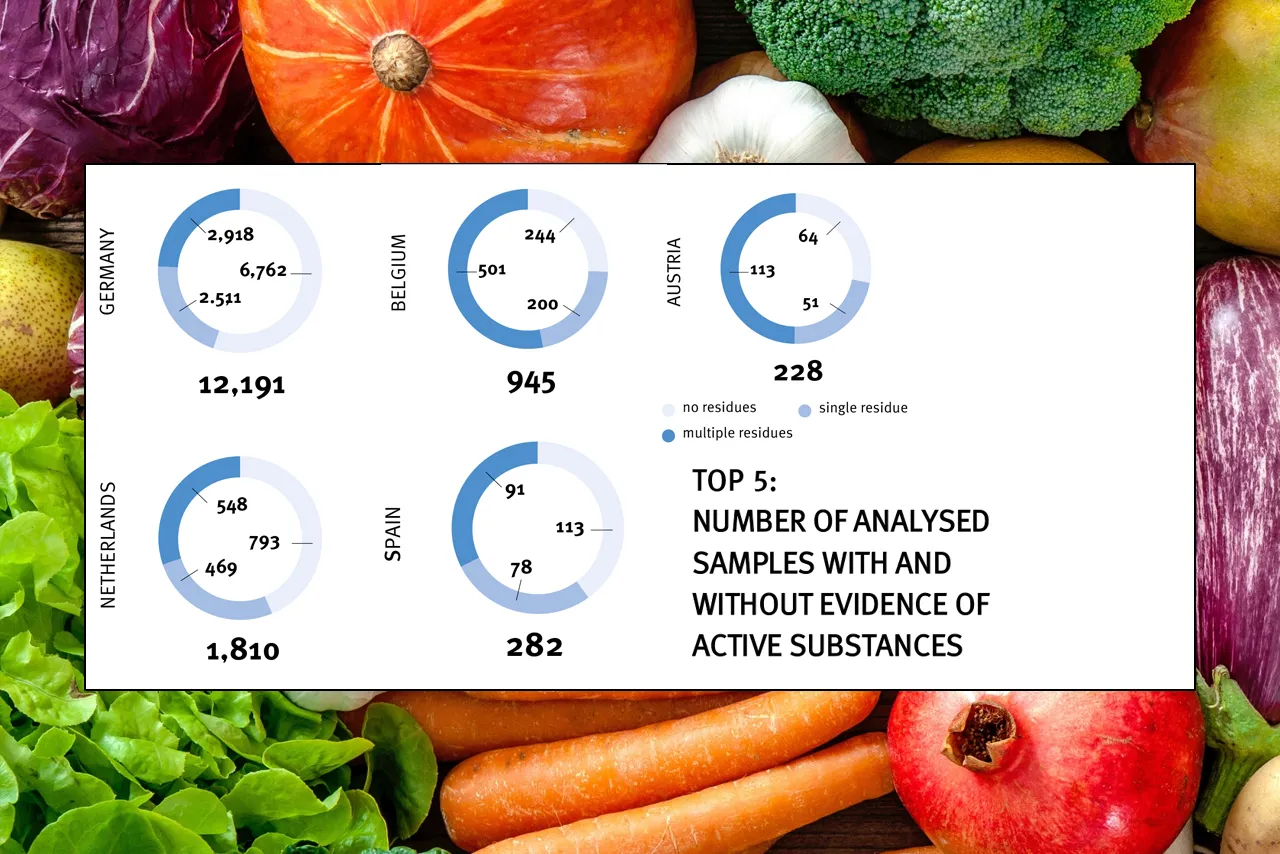
Number of samples analysed with and without evidence of active substances (Top 5 Europe)
6,762 of a total of 12,191 fruit and vegetable samples analysed from Germany showed no residues of pesticide active substances. In 2,511 samples from Germany, one pesticide active substance was detected, while the remaining 2,918 samples showed residues of several active substances. The infographic shows the ratio between residue-free fruit and vegetable samples and samples with single and multiple residues in the Netherlands, Belgium, Spain and Austria.
Number of samples and most important countries of origin of the analysed samples
- Number of samples analysed (total): 1,625
- Number/proportion of samples from Germany: 1,309 samples / 84.3 %
- Number/proportion of samples from the EU (excluding Germany): 243 samples / 15.6 %
- Most important countries of origin from the EU (excluding Germany):
- Austria (177 samples / 41 %)
- Netherlands (28 samples / 11.5% of samples)
- Belgium (27 samples / 11.1% of samples)
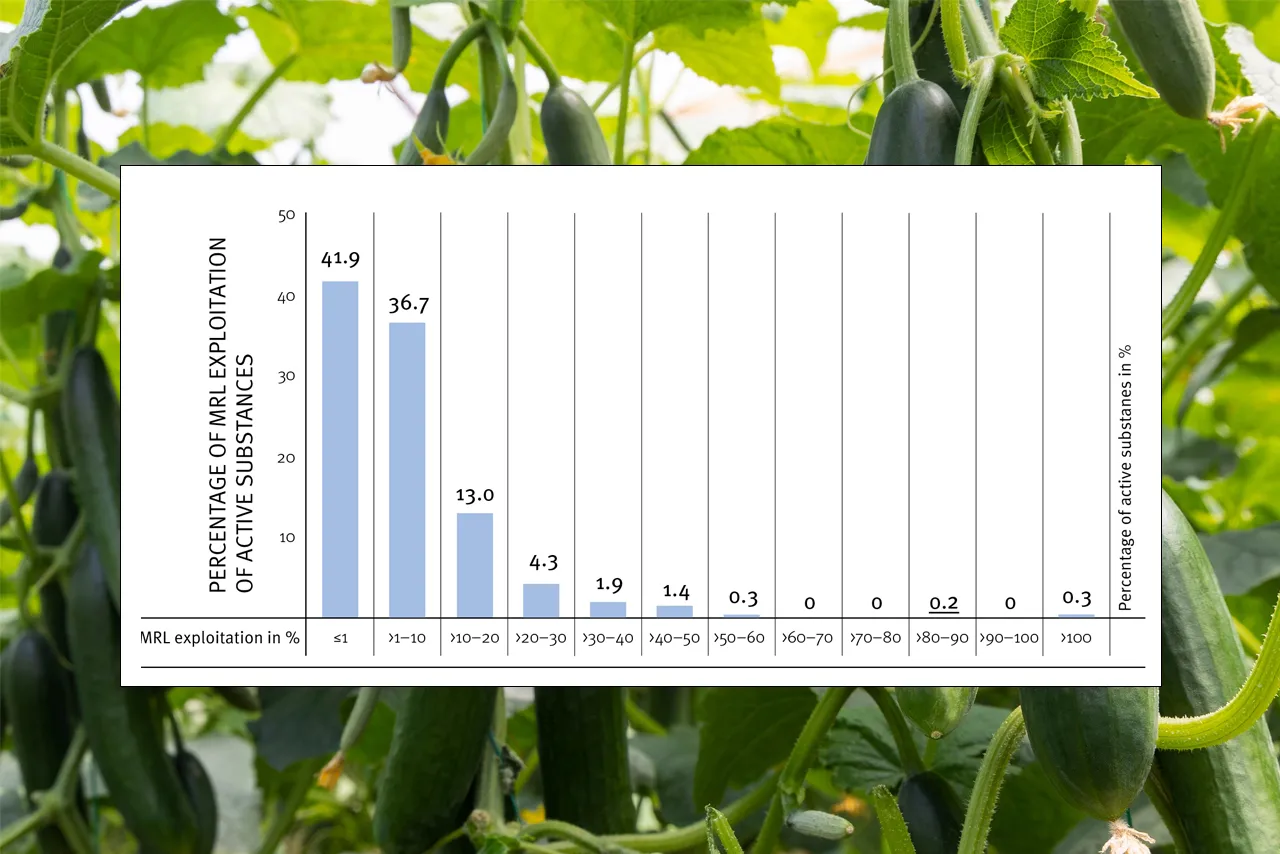
Percentage of MRL exploitation of active substances
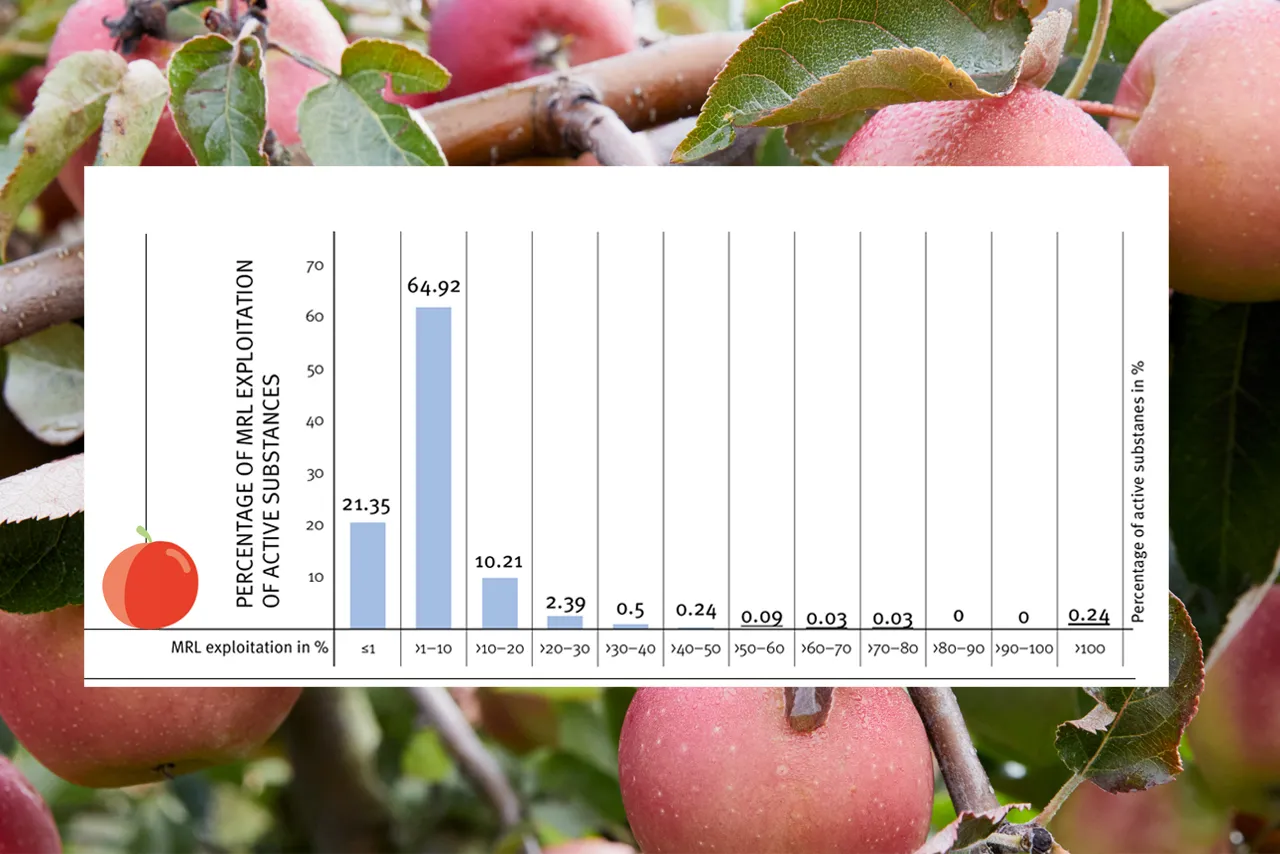
Click on the graphic to enlarge
- Number of samples without exceeding the MRL: 1,617
- Number of samples exceeding the MRL: 8
- Exceedance rate (total): 0.49 %
- Utilisation of the maximum residue levels was a maximum of 20 % for 96.4 % of the active substances found (see chart)
- Number of samples with not authorised active substances: 6
- Rate of rejections of not authorised active substances: 0.06%
- Number of samples with not authorised active substances and exceeding the MRL: 5
- Rate of total complaints (MRL exceeded & not authorised active substances): 0.55%
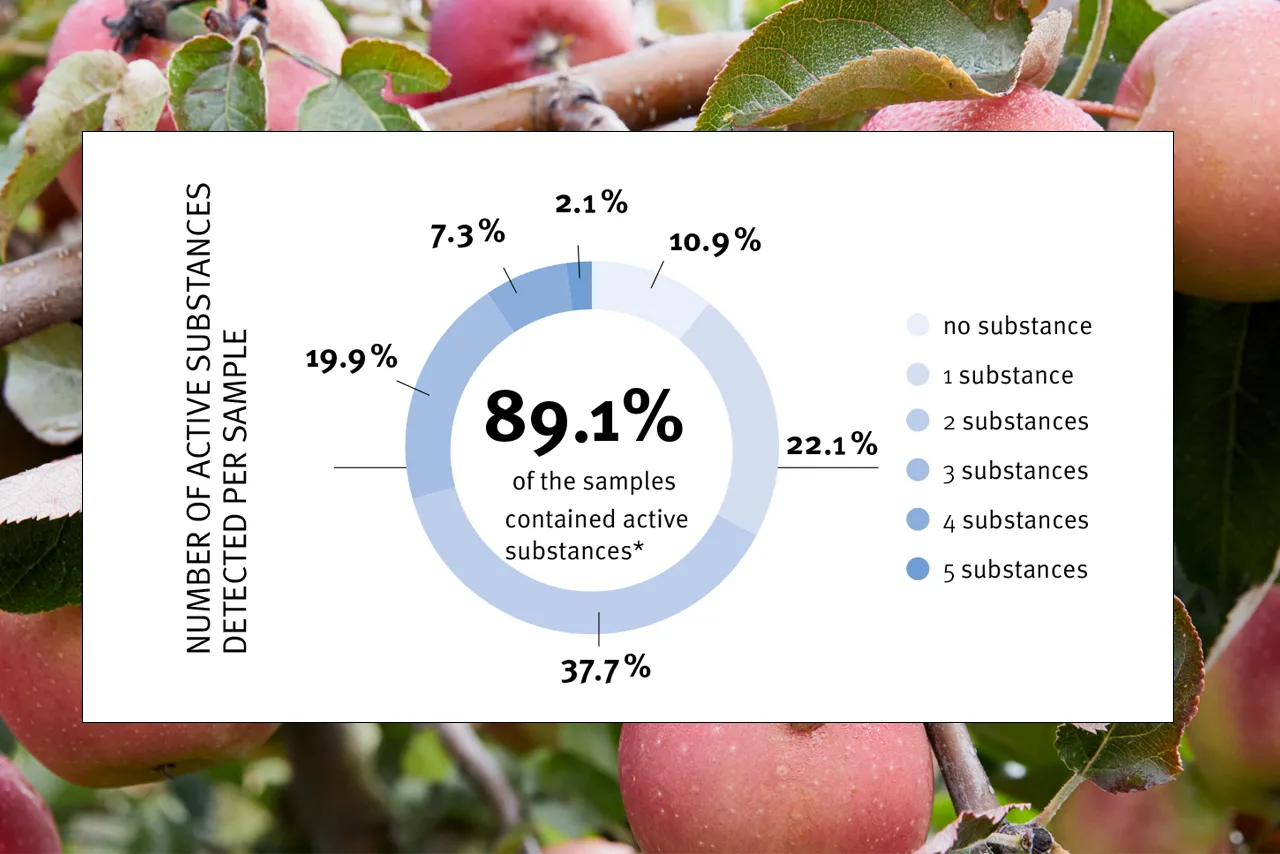
Number of active substances detected per sample
Click on the graphic to enlarge
- Samples without active substance detection: 177 / 10.9 % of samples
- Samples with active substance detection: 1,448 / 89.1 % of samples
- Samples with multiple residues: 1,089 / 67.0 % of samples
-
- Samples with 1 active substance detected: 359 / 22.1 % of samples
- Samples with 2 detected active substances: 613 / 37.7 % of the samples
- Samples with 3 detected active substances: 324 / 19.9 % of the samples
- Samples with 4 detected active substances: 118 / 7.3 % of the samples
- Samples with ≥ 5 detected active substances: 34 / 2.1 % of the sample
Click on the graphic to enlarge
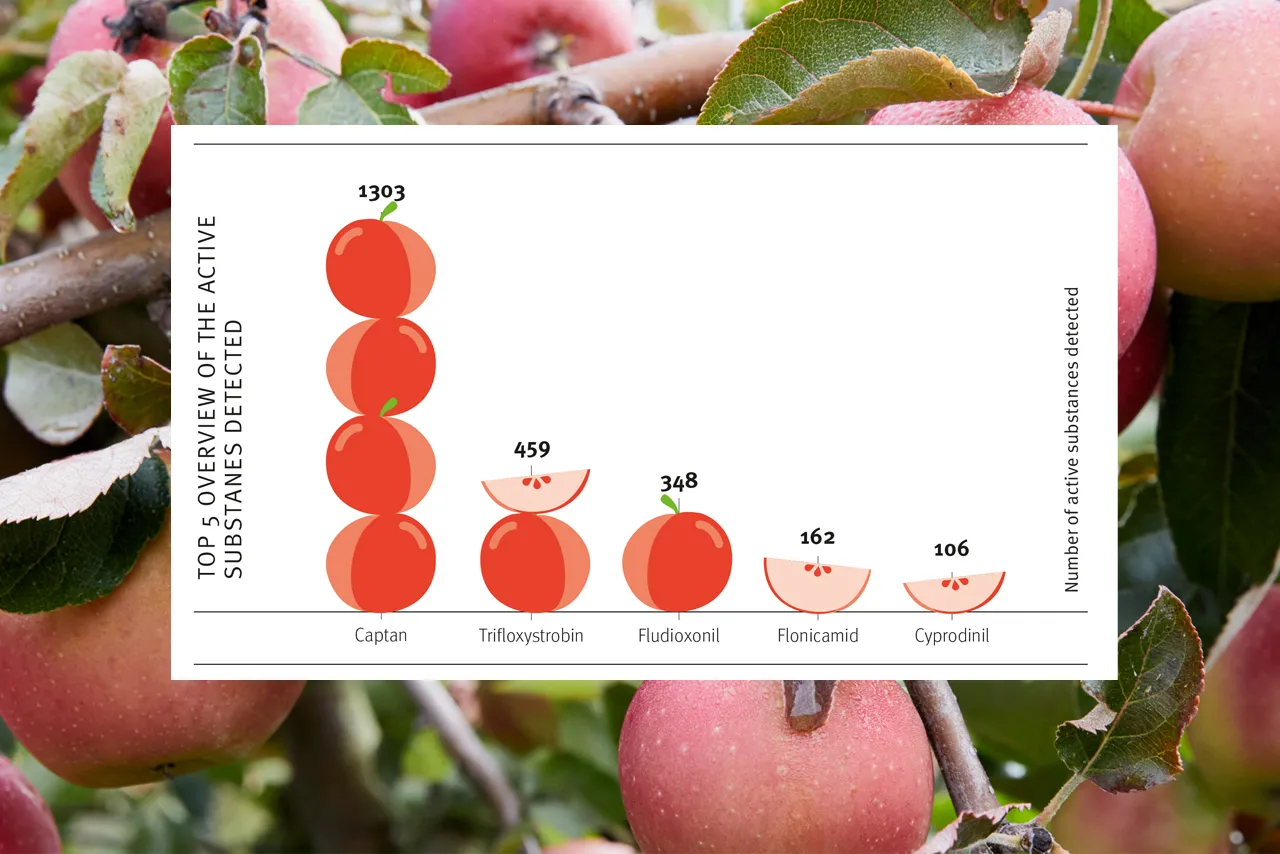
Top 5 - Overview of the active substances detected
1) Captan: 1,303 detections
2) Trifloxystrobin: 459 detections
3) Fludioxinil active substances: 348 detections
4) Flonicamid: 162 detections
5) Cyprodinil: 106 detections
Number of samples and most important countries of origin of the analysed samples
-
Number of samples analysed (total): 462
-
Number/proportion of samples from Germany: 191 samples / 41.3 %
-
Number/proportion of samples from the EU (excluding Germany): 271 samples / 58.7 %
-
-
Most important countries of origin from the EU (excluding Germany):
-
Netherlands (218 samples / 47.2 % of samples)
-
Belgium (28 samples / 6.1 % of the samples)
-
Austria (20 samples / 4.3 % of samples)
-
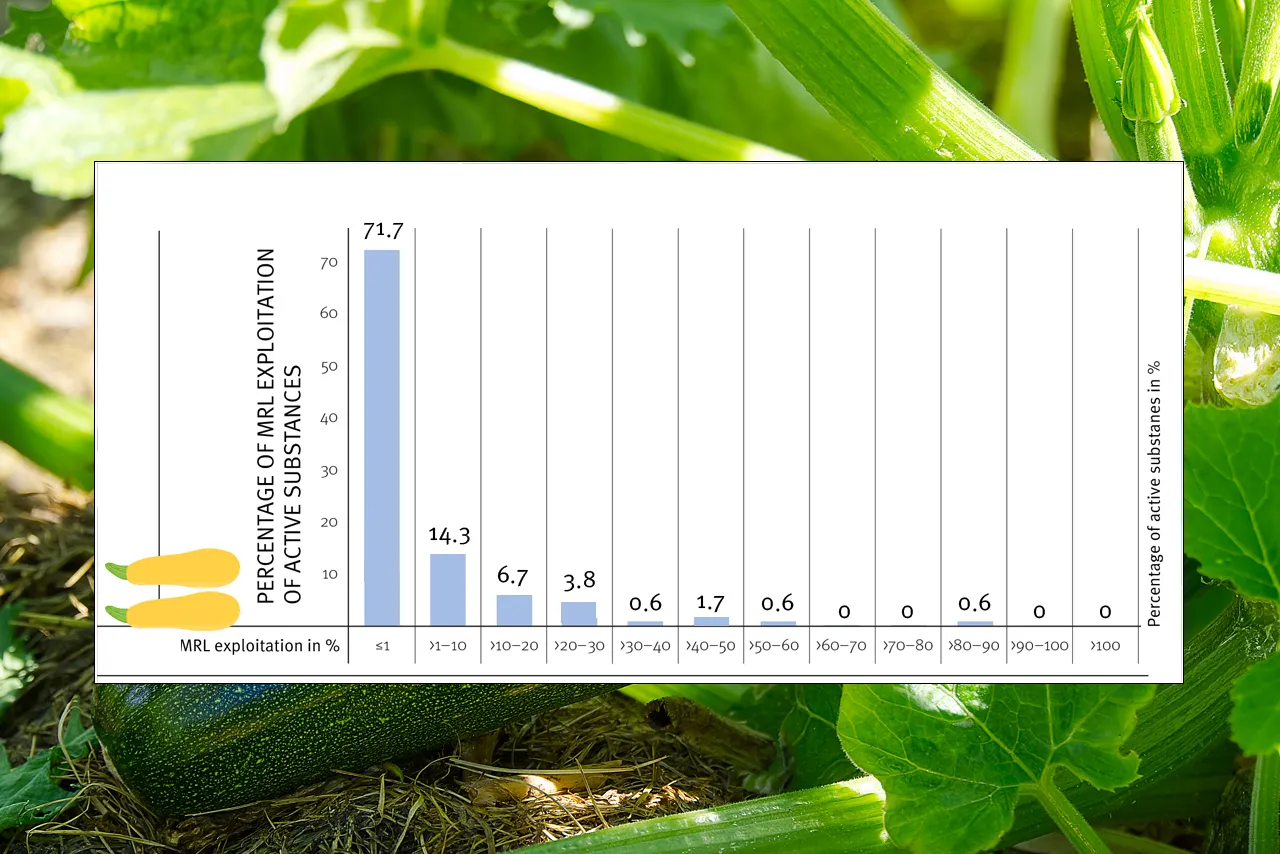
Percentage of MRL exploitation of active substances
Click on the graphic to enlarge
-
Number of samples not exceeding the MRL: 460 (99.6 % of samples)
-
Number of samples exceeding the MRL: 2
-
Exceedance rate (total): 0.4 %
-
The utilisation of the maximum residue levels was less than 20 % for 91.6 % of the active substances found (see chart)
-
Number of samples with not authorised active substances: 7
-
Rate of rejections of not authorised active substances: 1.51%
-
Rate of total complaints (MRL exceeded & not authorised active substances): 1.95%
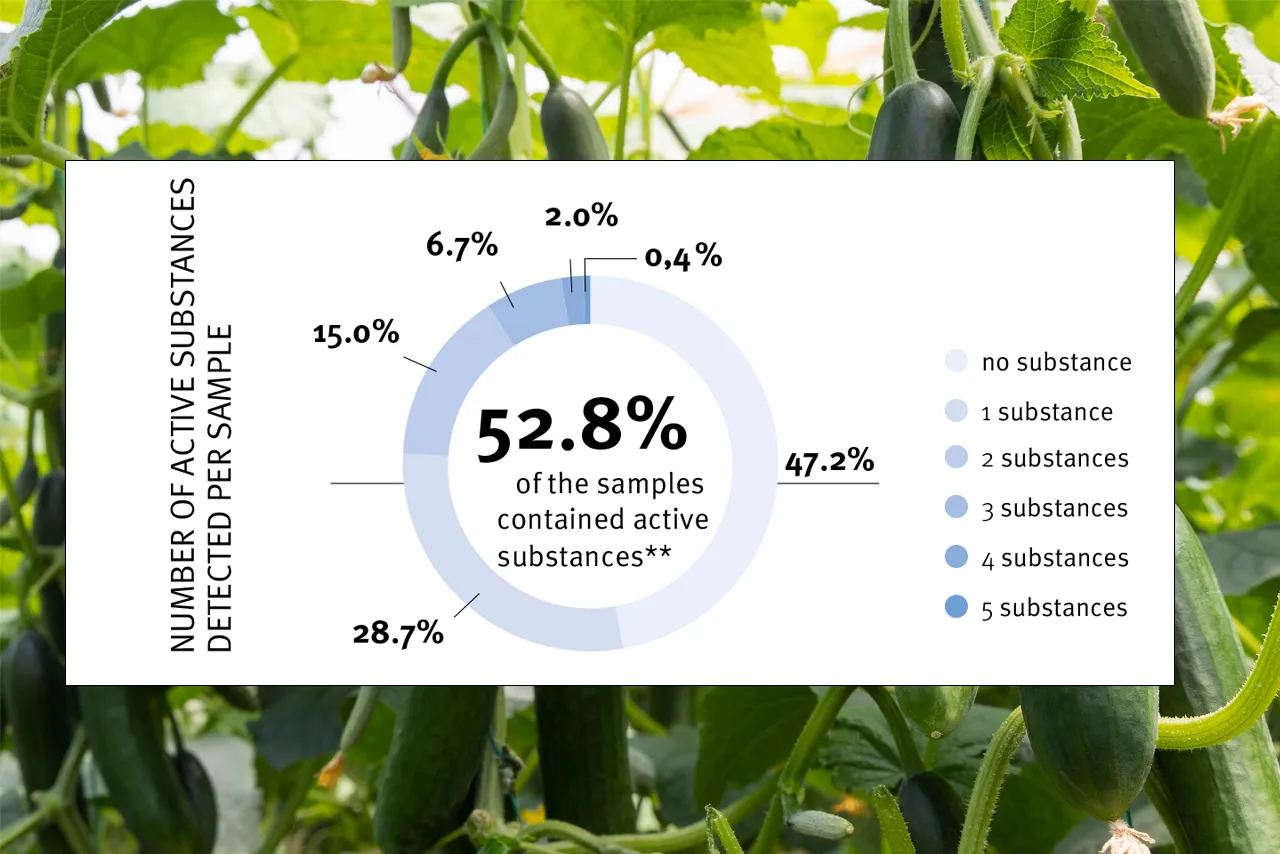
Number of active substances detected per sample
Click on the graphic to enlarge
- Samples without active substance detection: 218 / 47.2 % of the samples
- Samples with active substance detection: 244 / 52.8 % of samples
- Samples with multiple residues: 112 / 24.2 % of samples
- Samples with 1 active substance detected: 132 / 28.7 % of the samples
- Samples with 2 detected active substances: 69 / 15.0 % of the samples
- Samples with 3 detected active substances: 31 / 6.7 % of the samples
- Samples with 4 detected active substances: 10 / 2.0 % of the samples
- Samples with ≥ 5 detected active substances: 2 / 0.4 % of the sample
Click on the graphic to enlarge
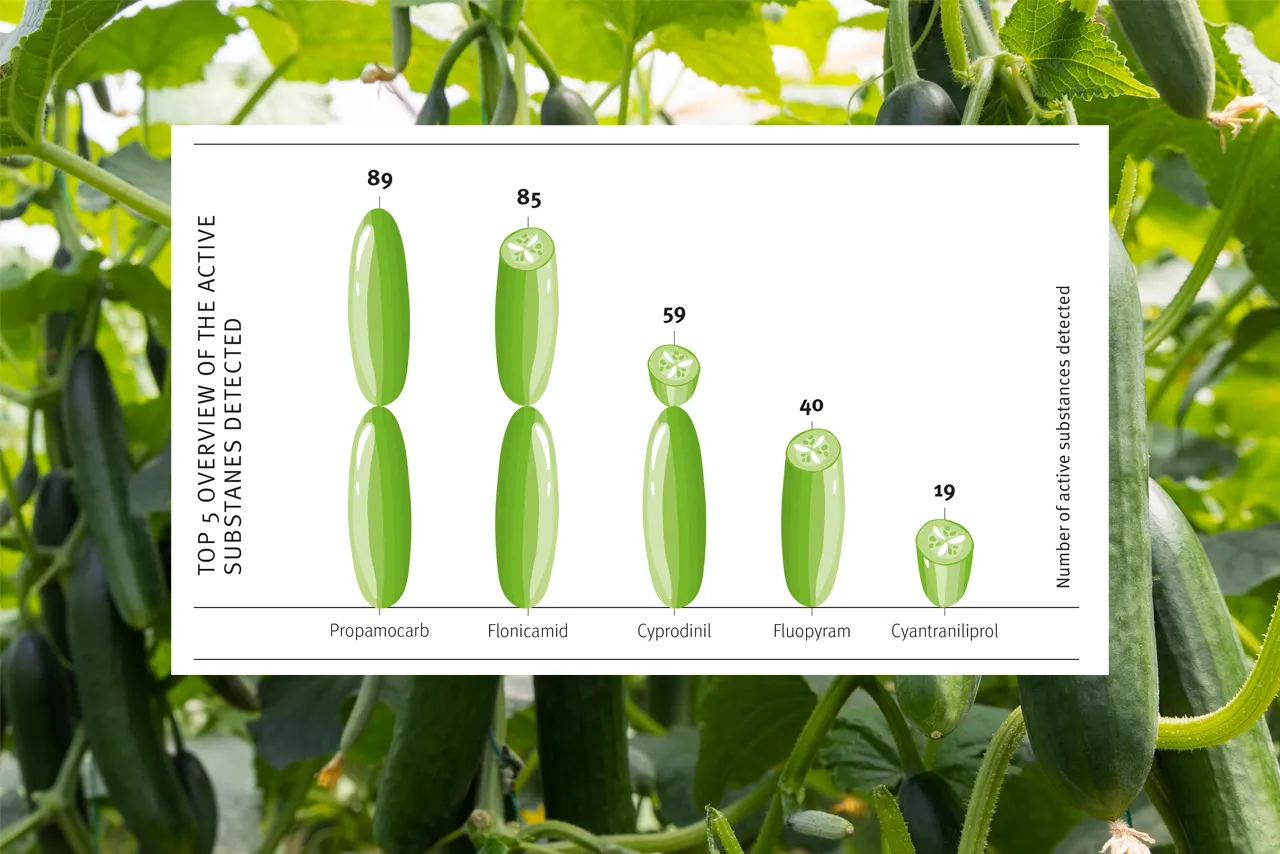
Top 5 - Overview of the active substances detected
1) Propamocarb: 89 detections
2) Flonicamid: 85 detections
3) Cyprodinil active substances: 59 detections
4) Fluopyram: 40 detections
5) Cyantraniliprole: 19 detections
Number of samples and most important countries of origin of the analysed samples
-
Number of samples analysed (total): 162
-
Number/proportion of samples from Germany: 105 samples / 65 %
-
Number/proportion of samples from the EU (excluding Germany): 57 samples / 35 %
-
-
Most important countries of origin from the EU (excluding Germany):
-
Belgium (33 samples / 20.2 %)
-
Netherlands (12 samples / 7.4 % of samples)
-
Spain (12 samples / 7.4 % of samples)
-
Percentage of MRL exploitation of active substances
Click on the graphic to enlarge
- Number of samples without exceeding the MRL: 162
- Number of samples exceeding the MRL: 0
- Exceedance rate (total): 0.0%
- Utilisation of the maximum residue levels was less than 20% for 92.8% of the active substances found (see chart)
- Number of samples with not authorised active substances: 5
- Rate of rejections of not authorised active substances: 3.1%
Number of active substances detected per sample
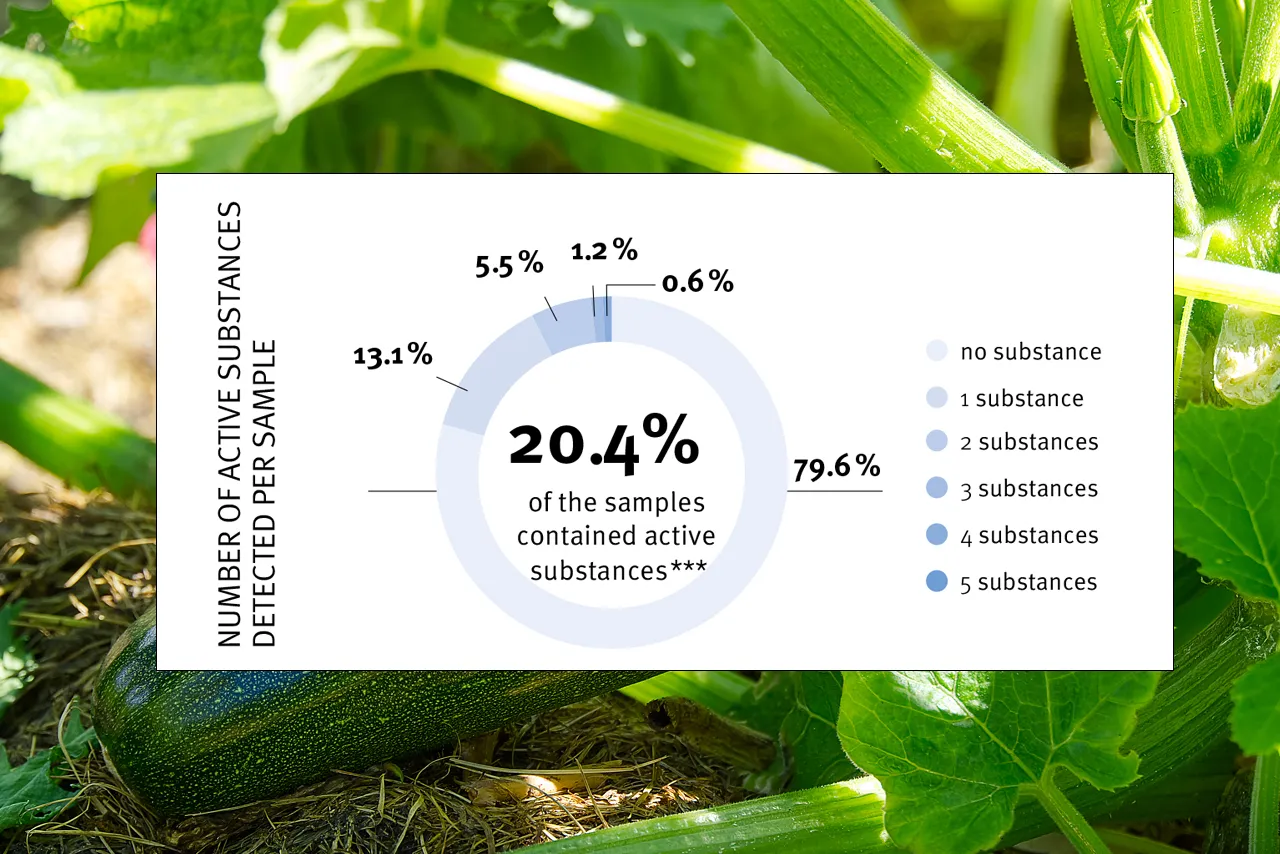
Click on the graphic to enlarge
- Samples without active substance detection: 129 / 79.6 % of the samples
- Samples with active substance detection: 33 / 20.4 % of the samples
- Samples with multiple residues: 12 / 7.4 % of samples
- Samples with 1 active substance detected: 21 / 13.1 % of samples
- Samples with 2 active substances detected: 9 / 5.5 % of samples
- Samples with 3 detected active substances: 2 / 1.2 % of the samples
- Samples with ≥ 4 detected active substances: 1 / 0.6 % of the samples
Click on the graphic to enlarge
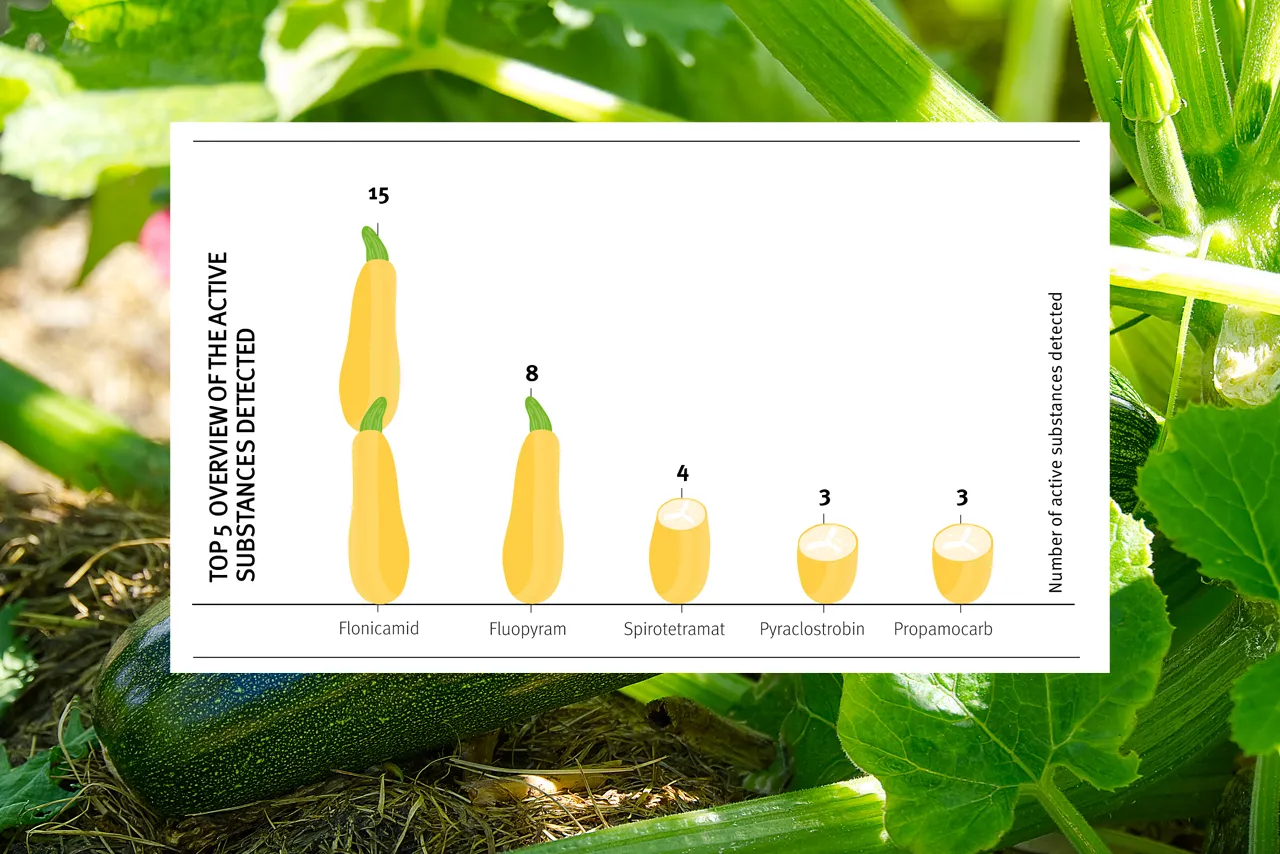
Top 5 - Overview of the active substances detected
1) Flonicamid: 15 detections
2) Fluopyram: 8 detections
3) Spirotetramat active substances: 4 detections
4) Pyraclostrobin: 3 detections
5) Promacarb: 3 detections