


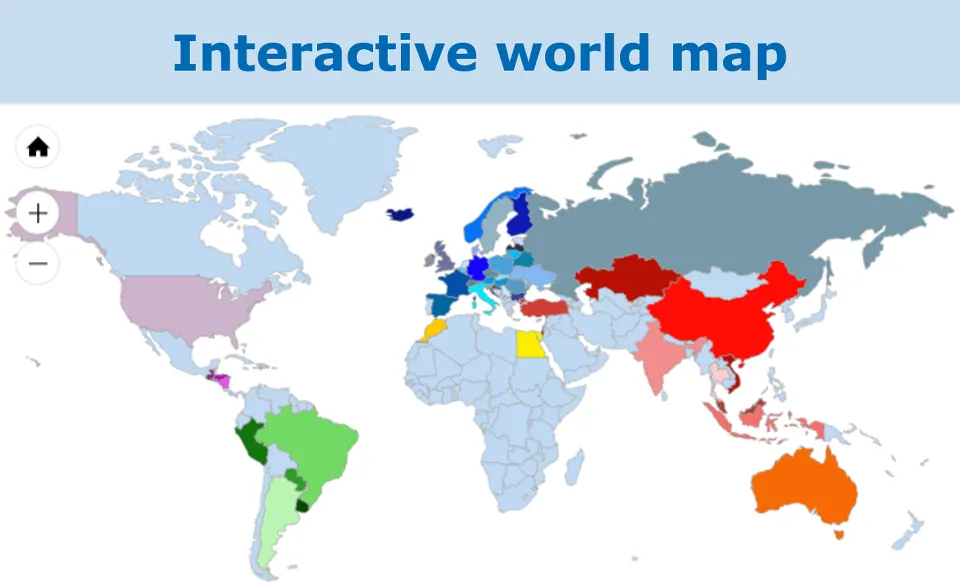
The interactive world map on the QS homepage for QS feed monitoring has been extended by the latest analysis results (period 07/2018 - 12/2018). The countries of origin Morocco and Norway are new, so that the map now contains the analysis results of 56 countries. In addition to a detailed overview of the residue situation in the international feed sector, the interactive world map also offers the possibility of comparing the data with the analysis results of the company's own feed.
It documents from which countries raw materials are procured in the QS scheme and which anomalies occurred with the respective feed. Among other things, you will learn whether the newly examined parameter prussic acid in linseed from Kazakhstan shows abnormalities, whether the analyzed maize samples from Thailand and Italy show abnormalities with regard to aflatoxin B1 and what the PAH contamination in seaweed meal from Norway is like. You can get the specific answer by simply clicking on the country of your choice on the world map.
The QS feed monitoring serves the consistent controlling of feed from the QS scheme. All feed producers, traders and those farms that mix their own feed participate in this monitoring. Throughout the year, systematic investigations are carried out to check whether maximum levels, limit values and guideline values for e.g. mycotoxins, dioxins, plant treatment products and heavy metals are complied with. Because high-quality feed is the basis of a good animal nutrition.