


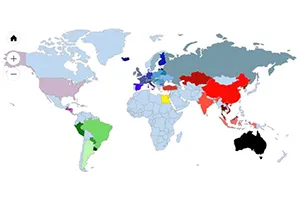
The interactive world map on the QS website has been enhanced with the latest QS feed monitoring analysis results and now includes the data for the period from January 1, 2016 to December 31, 2017. Approximately 50,000 samples were collected and analyzed within the QS feed monitoring during these two years. With our interactive world map, the most frequently sampled raw materials from 55 countries of origin and selected parameters can be accessed in aggregated form.
Which raw materials are from India? How many samples were collected in Argentina and how many analyzes were carried out there? Was there any abnormality in the results? Find out and just click on the desired country in the world map. In this way, you not only get a clear overview of the residue situation of the international feed sector, but you can also access the data for internal risk assessment or compare it with the analysis results of own animal feed.
QS feed monitoring is designed for the monitoring of feed out of the QS scheme. Throughout the year, analyses are systematically conducted and it is examined whether maximum levels, limit values and guide values for e.g. mycotoxins, dioxins, plant protection products and heavy metals are complied with. This ensures that only high-quality feed is used as animal food.