


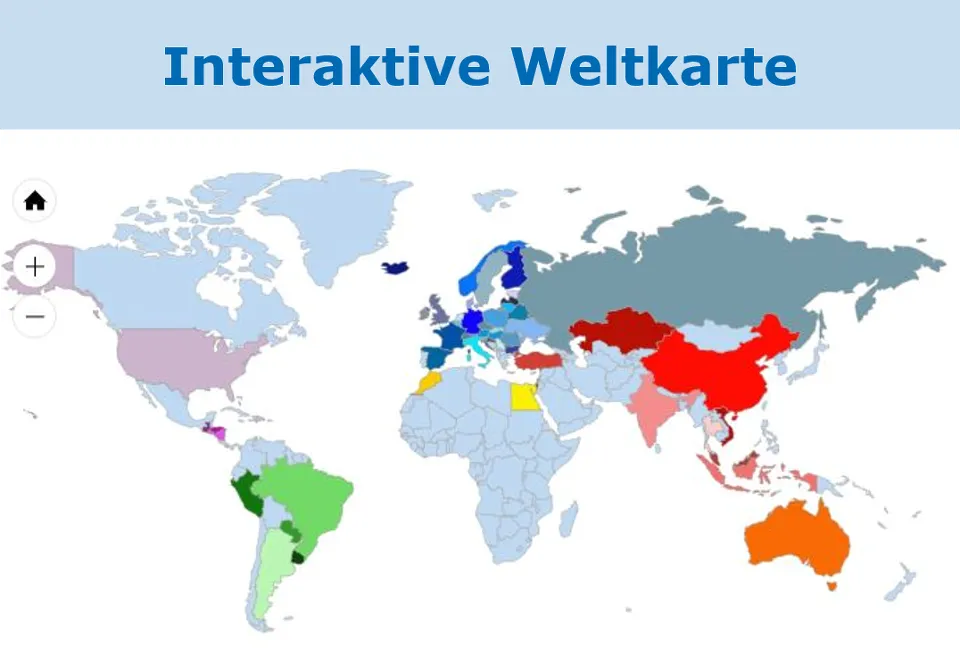
The interactive world map on the QS homepage for QS feed monitoring has been expanded to include the latest analysis results (period 07/2019 - 12/2019). It now includes analysis results for more than 25 product groups from 60 countries of origin. In addition to a detailed overview of raw material qualities in international trade, the interactive world map also offers the possibility to compare the data with the analysis results of own feeds.
The interactive world map can very well support companies in the risk assessment of their raw materials and their procurement within the framework of the HACCP concept,
says Claudia Brill, coordinator of the feed industry division at QS.
The QS feed monitoring serves the consistent monitoring of feed from the QS scheme. All feed producers, traders and those farms that mix their own feed participate in this. Throughout the year, systematic tests are carried out to check whether maximum levels, limit and guideline values for e.g. mycotoxins, dioxins, plant treatment products and heavy metals are adhered to. After all, high-quality feed is the basis of good animal nutrition.