


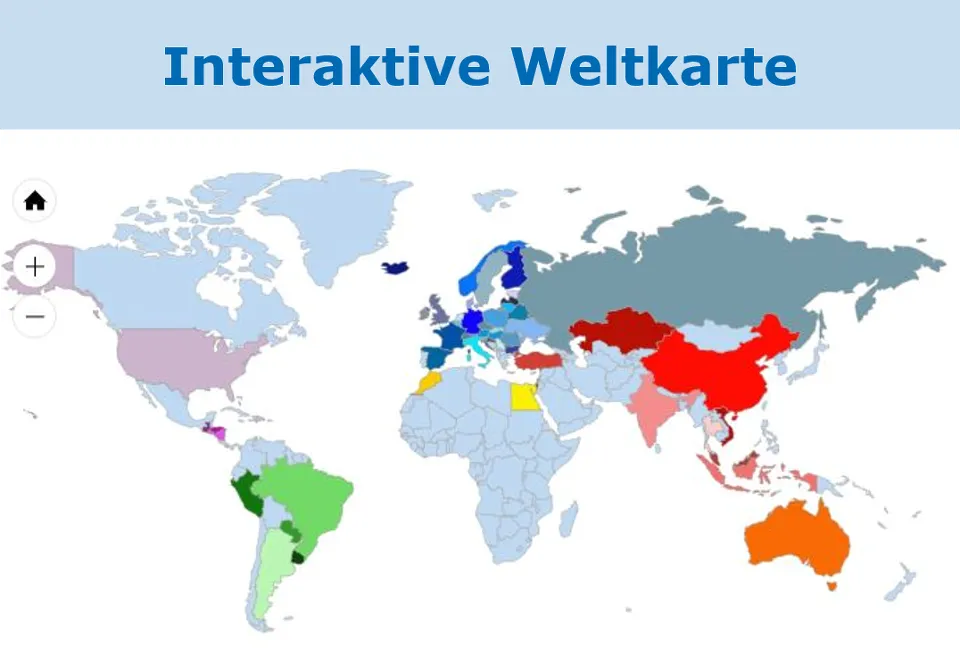
The interactive world map on the QS website has been extended by the latest analysis results of the QS feed monitoring and now includes the data for the period from 1 January 2016 to 30 June 2019. Using our interactive world map, the most frequently sampled raw materials from almost 60 countries of origin and selected parameters can be retrieved in aggregated form. The countries of South Africa and Greece have recently been added.
Which raw materials come from Australia? How many samples were taken and how many analysis were carried out in China? Were there any abnormalities in the results? Find out and simply click on the desired country on the world map. This not only gives you a clear overview of the residue situation in the international feed sector, but also allows you to use the data for internal risk assessment or to compare them with the analysis results of your own feed.
The QS feed monitoring serves the control of feeds from the QS scheme. Throughout the year, systematic inspections are carried out and it is checked whether maximum contents, limit and guideline values for e.g. mycotoxins, dioxins, plant treatment agents and heavy metals are complied with. This ensures that only high-quality feed is used.