


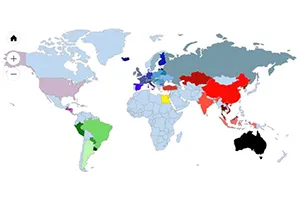
How many samples have been taken within the QS feed monitoring in China? Did the analysed maize samples from Thailand show any abnormalities regarding Aflatoxin B1? How many feed samples from Spain tested for Salmonella were positive? The interactive world map for QS feed monitoring provides information on these and many other questions. The world map has recently been extended to include the latest evaluation results and now includes analysis data from the period from 1 January 2016 to 30 June 2018.
In the last two and a half years 58,084 samples have been taken and analysed for QS feed monitoring. With our interactive world map, the most frequently sampled raw materials from 55 countries of origin and selected parameters can be called up in aggregated form. In addition to a detailed overview of the residue situation in the international feed sector, you can also use the data on the world map for internal risk assessment or compare it with the analyses results of your own feed.
QS feed monitoring serves to monitor feed from the QS scheme. Throughout the year, systematic tests are carried out to check whether maximum levels, limit and guideline values for e.g. mycotoxins, dioxins, pesticide residues and heavy metals are being observed. This ensures that only high-quality animal feed is used.
Raw material procurement in the QS system - interactive world map